OPENING QUESTIONS: Please work with your team to do a wee bit of research to gain a solid foundation for the the NOAA Tsunami Research Data page.
- Find the Kodiak Island earthquake from 2018 and review the specifics of the tsunami resulting from that event.
Then please look into the NOAA DART program. We will use data from ONE of those buoys to conduct our analysis. Pay particular attention to:
- Buoy Location
- The relationship between ocean depth and pressure
- The importance of using the "Zulu" time reference (This is really, really important)
LEARNING TARGET: I will conduct background research on the NOAA Center for Tsunami Research during today's class.
I will begin working on my 'Small Tsunami Wave Characteristics' graphing assignment during today's class.
WORDS O' THE DAY:
- frequency (waves/second or waves/minute)
- period ("seconds/wave or minutes/wave")
- amplitude (wave height)
- wavelength (distance from crest to crest)
- crest (the highest point of the wave)
- trough (the lowest point of the wave)
- speed = (wavelength x frequency. NOTE: (meters/
wave) x (waves/sec) = meters/sec - tsunami
- subduction zone
TSUNAMI WAVE EQUATION:
WORK O' THE DAY:
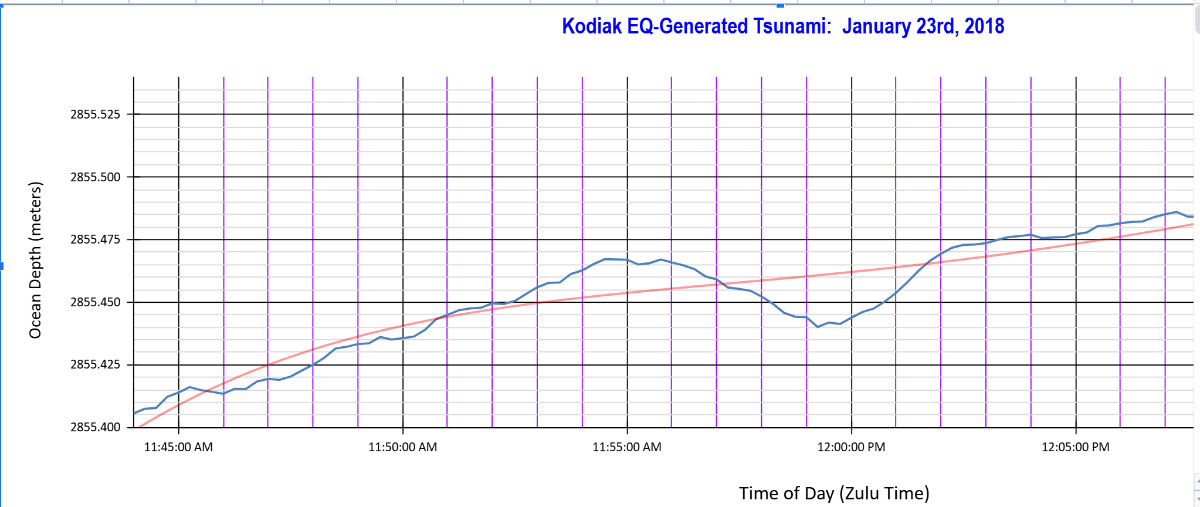
THE PURPOSE OF THIS INVESTIGATION IS TO PRECISELY MEASURE THE FIVE WAVE CHARACTERISTICS OF THE SMALL AMPLITUDE TSUNAMI GENERAGTED BY THE JANUARY 2018 KODIAK EQ.
You will document your efforts in a 'Training Video' that you narrate showing:
- All the steps that you took to create your graph as outlined on this page
- The calculations you made to measure the five wave characteristics of that tsunami
- Go to the NOAA Tsunami page and find the data and time of the 7.9 M earthquake centered under Kodiak Island in Alaska in January of 2018
-
Review the tsunami data there
- Now find your way to the NOAA National Centers for Environmental Information National Hazards Viewer
-
Find buoy 46419 off the Pacific Northwest Coast. We will use the data from that buoy as the basis for this graphing project.
-
From the information you already have (or have access to!) determine which dataset contains the data you will use for your investigation
-
You won't be able to process the massive amount of data (millions of records) contained in that data set. I was a database consultant/analyst in a previous career so I have already done that.
-
DART buoy sensors take data every 15 seconds. With that in mind, determine the time period (in hours) that you would like your data and I will provide it to you as a .csv (comma separated values) file. You can import that into Google Sheets
-
-
-
The data you'll see in Google Sheets is very raw. You'll need to rename the data columns appropriately (Time of Day and Ocean Depth (in meters)
- Format the data columns appropriately (Ocean Depth should be to the millimeter which is... how many sig figs???)
-
Create a well crafter scatter plot graph with trendline to precisely match the following:
Use your graph and other information determined so far to as precisely as you can measure the 5 tsunami wave characteristics for that tsunami wave!
Now create a narrated training video that shows all of your work from start to finish!
And yes, this is a BUCKET LOAD of work!